We recently made an interesting discovery. Paid Ads on G2 seem to correlate with higher AI citation rates. How could that be?
To understand the relationship between G2 Ads and AI visibility, I used Profound AI to analyze AI citations by ChatGPT, Perplexity, Apple/Siri, and Google’s AI surfaces over 180 days across 127,554 products listed on G2. Ad status was based on G2 internal records, and results were controlled for factors like review count, profile completeness, plan tier, contract value, and company size.
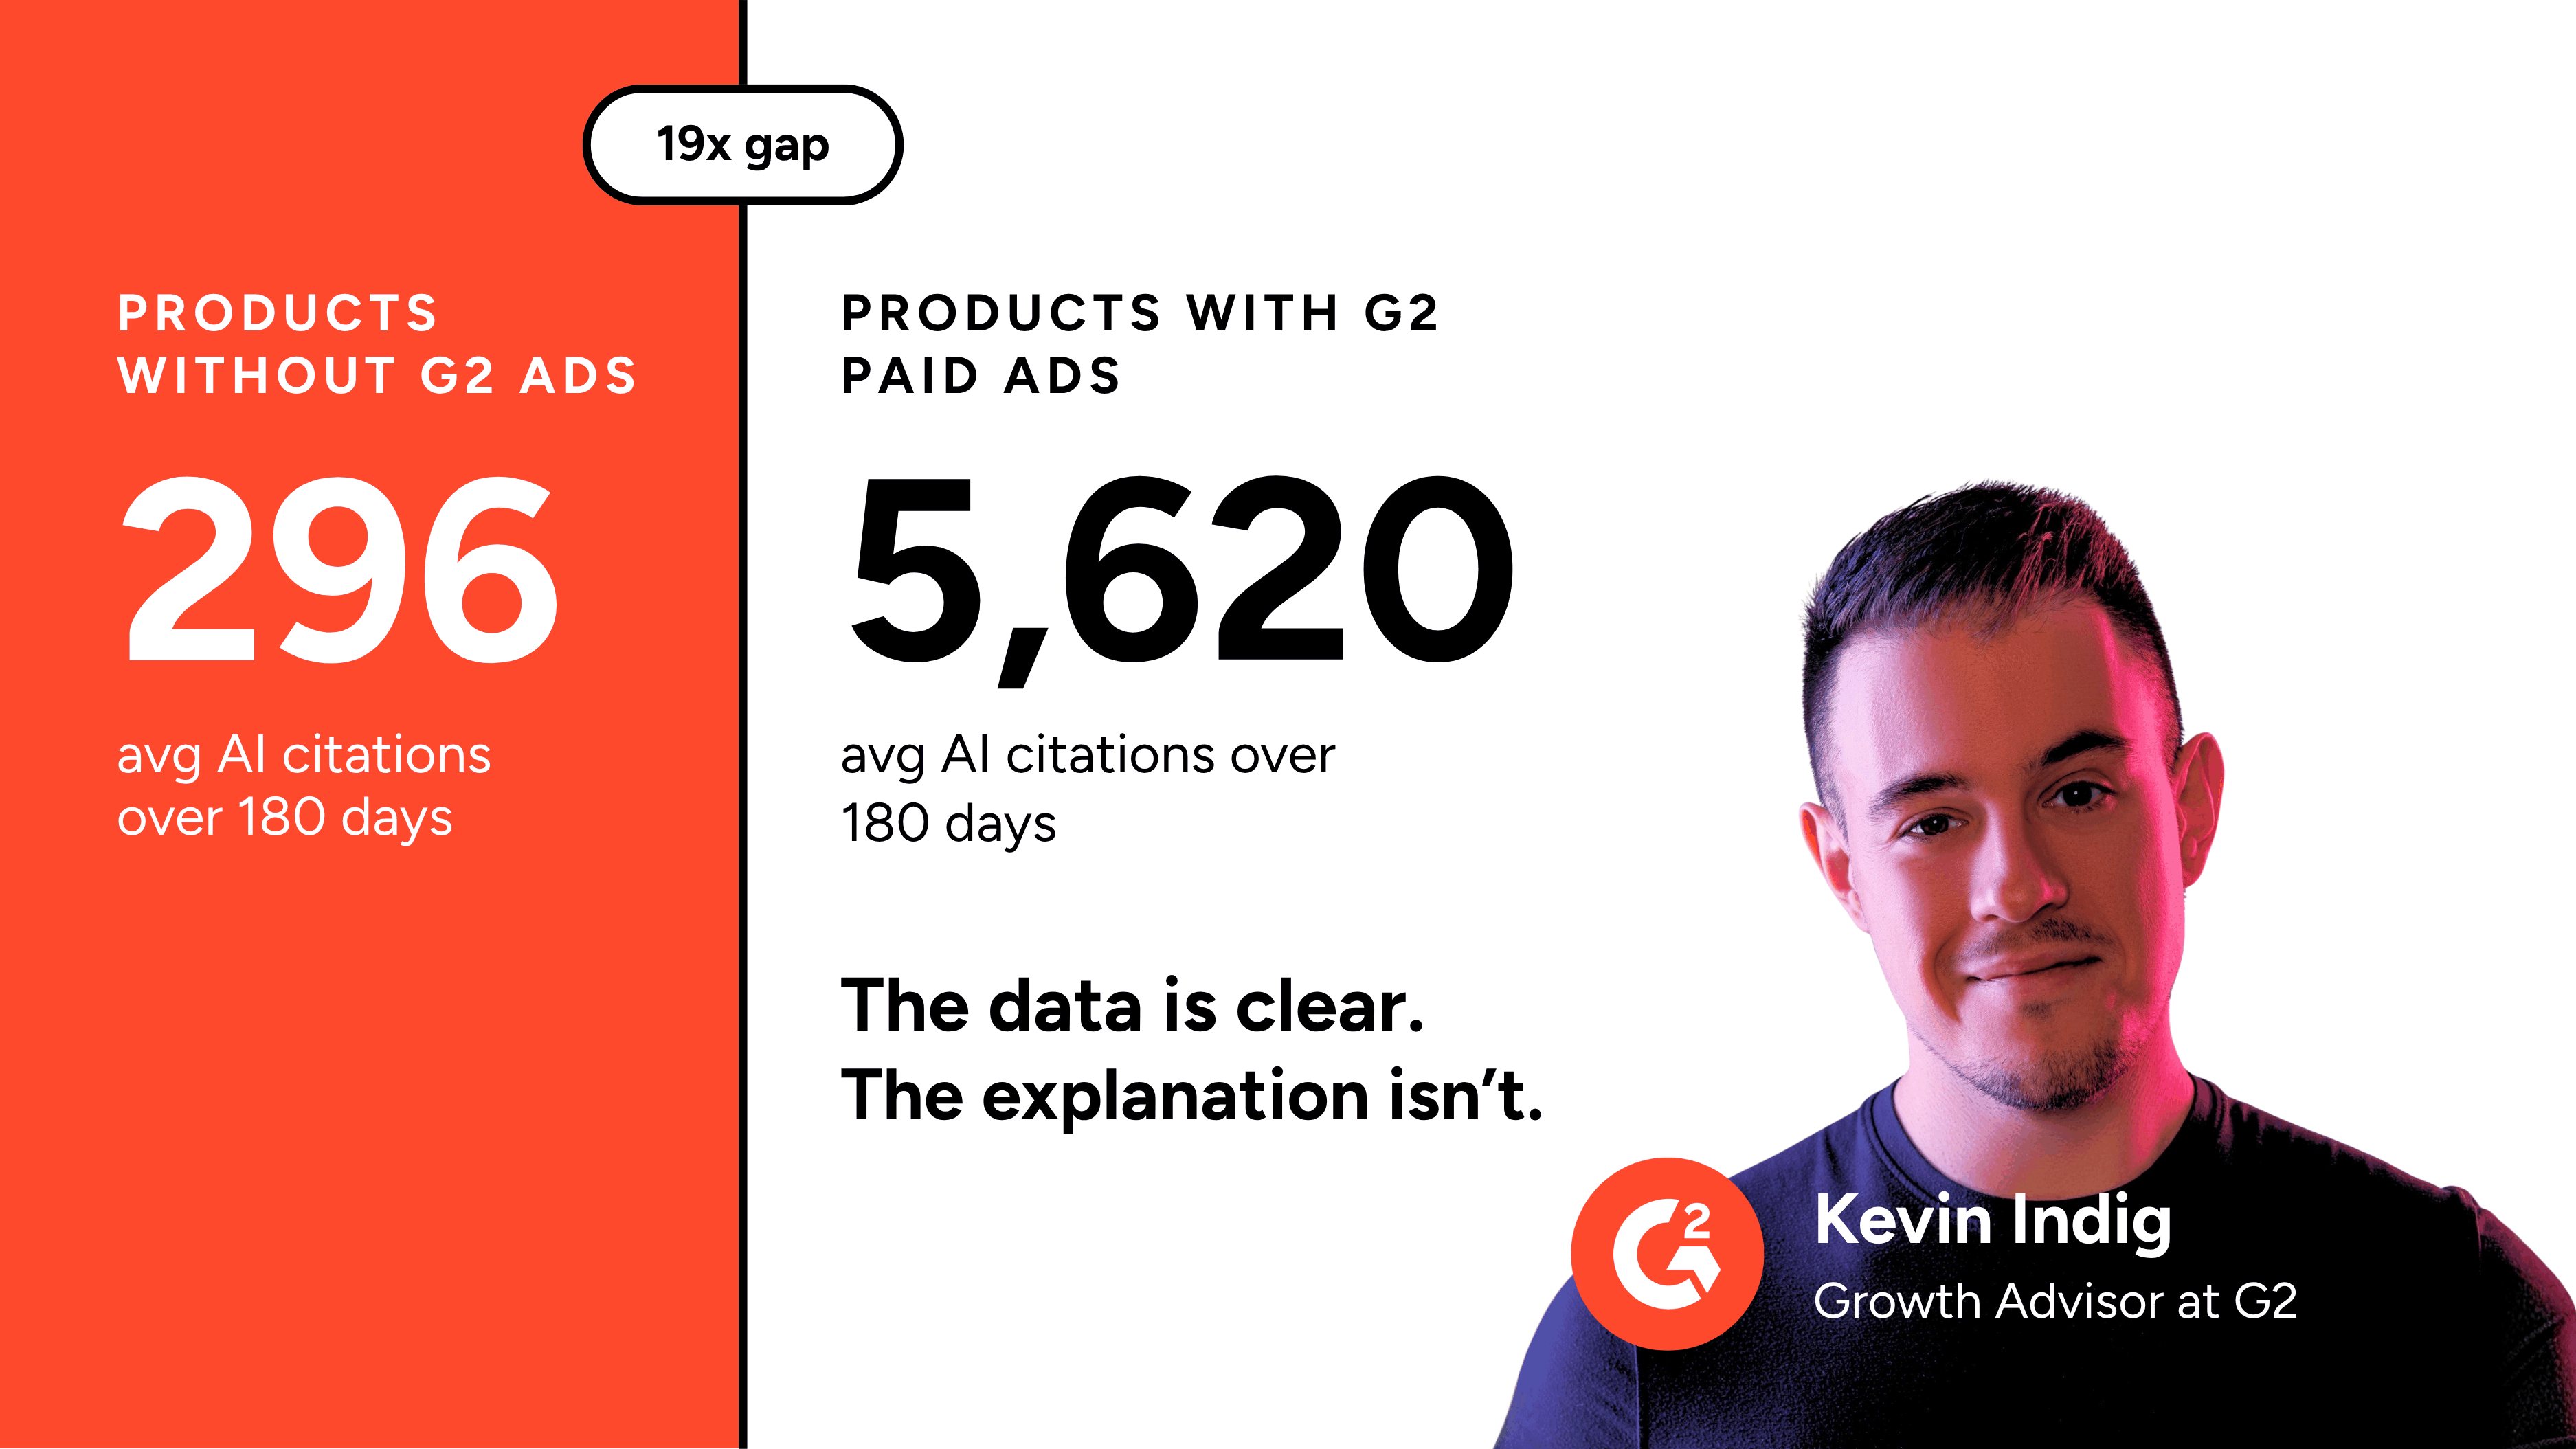
From this analysis, we found that products running paid ads average 5,620 AI citations over 180 days. Products without ads: 296. That's a 19x gap. The more we controlled for confounding variables, the more the gap shrank, but it never disappeared entirely.
1) The two groups differ in more than ad spend
19x is the mean ratio across 127,554 products tracked by Profound AI. 1,280 of the total products run paid G2 Ads. 126,274 don't. At the median, the gap is even wider: 2,609 versus 6 citations.
| |
Running paid ads
|
No paid ads
|
|
Products
|
1,280
|
126,274
|
|
Avg citations (180 days)
|
5,620
|
296
|
|
Median citations
|
2,609
|
6
|
|
Avg citation rate per pageview
|
4.6
|
3.0
|
|
Median citation rate per pageview
|
3.6
|
2.3
|
However, the two groups differ in more than just ad spend. Products that run G2 ads tend to be larger companies on paid G2 plans with more reviews and more complete profiles.
|
Plan tier
|
No ads (avg citations)
|
With ads (avg citations)
|
|
Enterprise
|
4,320
|
8,605
|
|
Mid paid
|
3,482
|
5,198
|
|
Entry paid
|
1,222
|
1,374
|
|
Free / No plan
|
157
|
5,761*
|
*Only 3 free products run ads. Not a reliable comparison.
All of those variables independently drive citations. To isolate the ad effect, we need to control for them one by one.
2) Reviews explain most of the effect
When you bucket products by review count and compare within each bucket, the ad effect compresses.
Products with 500+ reviews and ads have a median of 10,153 citations. Without ads, 6,404. That's a 1.6x lift, not a 19x one. At 101–500 reviews: 3,130 versus 2,097, a 1.5x lift.
|
Review count
|
No ads (median)
|
With ads (median)
|
Ad lift
|
|
0 reviews
|
3
|
28
|
9x
|
|
1–25
|
15
|
267
|
18x
|
|
26–100
|
413
|
1,030
|
2.5x
|
|
101–500
|
2,097
|
3,130
|
1.5x
|
|
500+
|
6,404
|
10,153
|
1.6x
|
The lower review buckets show larger lifts (9x at 0 reviews, 18x at 1–25 reviews), but those are based on tiny samples: 3 ad products with 0 reviews and 125 with 1–25. The reliable signal comes from the 26+ review cohorts, where the lift settles to 1.5–2.5x.
Reviews dominate the equation again. Within the no-ads group alone, going from 0 to 500+ reviews lifts median citations from 3 to 6,404. That's 2,135x. The ad effect at any given review level is real but modest compared to the review effect.
3) Traffic alone doesn't account for the rest
If reviews and company size explained the full gap, the citation-to-pageview ratio should be similar between the two groups. It's not.
Products with ads have a median of 3.6 citations per pageview. Without ads: 2.3. That's 57% higher. Ad products don't just get more citations because they get more traffic. They get cited more often per visit.
Why? We're not sure. One possibility: Companies that run G2 ads also tend to invest more in their G2 profiles. They update content more often, solicit more detailed reviews, and fill out more structured fields. Better profiles may be easier for LLMs to cite, regardless of ad spend.
4) The effect persists after every control we tested
The strongest test: Compare products within the same spend tier, contract type, and company size. If the ad effect disappears inside these cells, it was always a proxy for budget.
It doesn't disappear.
|
Plan tier
|
Company size
|
No ads (avg)
|
With ads (avg)
|
Uplift
|
|
Mid ($5k–$15k)
|
Mid-market
|
3,940
|
7,579
|
+92%
|
|
Mid ($5k–$15k)
|
Unknown
|
2,848
|
4,585
|
+61%
|
|
High ($15k–$40k)
|
SMB
|
5,223
|
7,591
|
+45%
|
|
High ($15k–$40k)
|
Unknown
|
3,847
|
5,577
|
+45%
|
|
High ($15k–$40k)
|
Large Enterprise
|
4,530
|
6,482
|
+43%
|
|
Enterprise ($40k+)
|
SMB
|
7,639
|
10,819
|
+42%
|
|
Enterprise ($40k+)
|
Mid-Market
|
10,455
|
13,906
|
+33%
|
|
High ($15k–$40k)
|
Enterprise
|
4,584
|
5,857
|
+28%
|
|
High ($15k–$40k)
|
Mid-Market
|
4,328
|
5,507
|
+27%
|
|
Enterprise ($40k+)
|
Enterprise
|
10,004
|
12,366
|
+24%
|
The uplift ranges from +24% to +92% across the 10 largest cohorts. Mid-market companies on mid-tier plans see the strongest effect (+92%). Enterprise companies on enterprise plans see the weakest (+24%).
Two cells go negative: low-cost monthly contracts (-13%) and mid-tier plans at enterprise companies (-39%). Both have 3 ad products. Too small to read into.
5) Most of the signal comes from OpenAI and Perplexity
Breaking citations by LLM source shows an uneven response to the ad signal.
|
LLM
|
No ads (median)
|
With ads (median)
|
Ratio
|
|
OpenAI
|
20
|
3,365
|
168x
|
|
Perplexity
|
7
|
442
|
63x
|
|
Apple
|
13
|
138
|
11x
|
|
Google
|
2
|
22
|
11x
|
OpenAI and Perplexity account for the bulk of the lift. Apple and Google show 10–11x gaps, but at much lower absolute volumes.
This tracks with overall citation volume by LLM. OpenAI generates the most citations across all products, so the ad gap shows up there first and biggest.
6) Three hypotheses, no proof yet
The correlation between G2 ads and AI citations survives every control we threw at it: review count, profile completeness, plan tier, contract value, and company size. After all of them, the effect is +24% to +92%, depending on the segment. We can't run the experiment we'd need (randomly assign ads and measure citation changes), and the ad data predates the citation tracking, so before/after is off the table.
Three hypotheses for what's going on:
Profile investment we can't measure: Companies that buy ads also invest more in their G2 presence in ways we can't control for: update frequency, review solicitation effort, and content quality. The ad spend may just be a marker for "takes G2 seriously."
Crawl and training signal: Paid ads drive more G2 pageviews, which could increase how often LLM crawlers encounter and index the page. More crawl activity, more freshness signals, more training data.
Category visibility: Ad products appear more prominently in G2 category pages and comparison views. If LLMs use G2's category structure as a source, higher placement could mean more citations.
We don’t know which of these is right. Most likely, it’s a combination of factors. And while the mechanism is still open, what we do know, and the data tells us, is that the correlation is real.
Methodology: 127,554 products listed on G2 tracked by Profound AI across ChatGPT, Perplexity, Apple/Siri, and Google AI surfaces over 180 days (Oct 2025 to Apr 2026). Ad status based on G2 internal records. Controls computed by cross-tabulating ad status with review count buckets, profile completeness quartiles, plan tier, contract value tier, and company size. Cells with fewer than 10 products in either group were excluded from controlled comparisons.
content_marketing_seller
.png?width=50&height=50&name=Kevin%20Indig%20headshot%20(2).png)
.png?width=400&height=220&name=Kevin%20Indig%20Blog%20April%202026%20(1).png)
.png?width=800&height=150&name=Kevin%20Indig%20headshot%20(2).png)
.png?width=400&height=220&name=Kevin%20Indig%20Blogs%20AprilMay%202026%20(1).png)
